In order to understand ice formation and the types of ice in the Great Lakes, researchers and stakeholders use Synthetic Aperture Radar (SAR) data from the NOAA CoastWatch Great Lakes Node to monitor the ice conditions such as six different types of ice, ice thickness, and ice cover.
Available ice products:
ICECON (Ice Type)
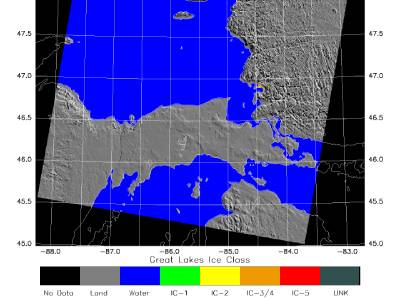
ICECON (or Ice Classification) is an ice map. The colors in ice map represent ice type, ice thickness ranges, and ICECON severity index (impact on vessels).
Ice Statistics
Great Lakes ice statistics data include the data file for ice concentration and long term average ice concentration compared to current year’s ice concentration.